
Correlational chart in PowerBI
Correlation charts can be used to show how strong a relationship is between variables. Correlations are calculated using the correlation coefficient formula. in our example we will be using a car attribute datasets containing the different attributes of cars.
Lets look at some examples of the Types of correlations we are expecting.
1 – Positive Correlation (Strong Positive Relationship – Coefficient Between 0 and 1)
The number of Cylinders in a car is positively correlated to the horsepower of the car.
IOW The more cylinders a car has the more the horsepower. (Coefficient = 0.8)
2 – Negative Correlation (Strong negative relationship – Coefficient between -1 and 0)
The Horsepower of a Car is negatively correlated to the Miles Per Gallon,
IOW The higher the horsepower of a vehicle the more fuel it consumes.
Before we head over to Power BI to start creating the Correlation chart consider the formula for the Correlation Coefficient as below
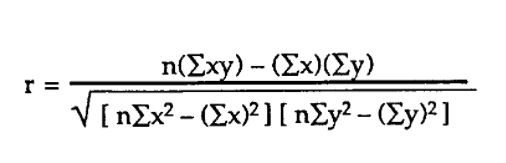
Also refer to the following page for more info on the statistical theory of Correlations.
The Correlation chart in PowerBI can be viewed here.
Steps to create in PowerBI
1 – Create a Matrix Chart – Add the Attributes as a X axis and also as a Y Axis
2 – Create the Correlation Coefficient Formula in DAX as a Measure
(Note you create the elements of the Formula as measures)
3- Change the conditional Formatting of Chart to display colors for each identification of the correlation pattern.
//measure 1
XY =
VAR CurrentX = SELECTEDVALUE(MTCarAttributez2[Attribute])
VAR CurrentY = SELECTEDVALUE(MTCarAttributez1[Attribute])
VAR Virtual =
SUMMARIZE(
    MTCarsPivotz,
    MTCarsPivotz[Index],
    "X", CALCULATE(MAX(MTCarsPivotz[Value]), MTCarsPivotz[Attribute] = CurrentX),
    "Y", CALCULATE(MAX(MTCarsPivotz[Value]), MTCarsPivotz[Attribute] = CurrentY)
)
RETURN
SUMX(
    Virtual,
    [X] * [Y]
)
//Measure 2
X =
VAR CurrentX = SELECTEDVALUE(MTCarAttributez2[Attribute])
VAR CurrentY = SELECTEDVALUE(MTCarAttributez1[Attribute])
VAR Virtual =
SUMMARIZE(
    MTCarsPivotz,
    MTCarsPivotz[Index],
    "X", CALCULATE(MAX(MTCarsPivotz[Value]), MTCarsPivotz[Attribute] = CurrentX),
    "Y", CALCULATE(MAX(MTCarsPivotz[Value]), MTCarsPivotz[Attribute] = CurrentY)
)
RETURN
SUMX(
    Virtual,
    [X]
)
//Measure 3
Y = VAR CurrentX = SELECTEDVALUE(MTCarAttributez2[Attribute])
VAR CurrentY = SELECTEDVALUE(MTCarAttributez1[Attribute])
VAR Virtual =
SUMMARIZE(
    MTCarsPivotz,
    MTCarsPivotz[Index],
    "X", CALCULATE(MAX(MTCarsPivotz[Value]), MTCarsPivotz[Attribute] = CurrentX),
    "Y", CALCULATE(MAX(MTCarsPivotz[Value]), MTCarsPivotz[Attribute] = CurrentY)
)
RETURN
SUMX(
    Virtual,
    [Y]
)

//Measure 4
X^2 = VAR CurrentX = SELECTEDVALUE(MTCarAttributez2[Attribute])
VAR CurrentY = SELECTEDVALUE(MTCarAttributez1[Attribute])
VAR Virtual =
SUMMARIZE(
    MTCarsPivotz,
    MTCarsPivotz[Index],
    "X", CALCULATE(MAX(MTCarsPivotz[Value]), MTCarsPivotz[Attribute] = CurrentX),
    "Y", CALCULATE(MAX(MTCarsPivotz[Value]), MTCarsPivotz[Attribute] = CurrentY)
)
RETURN
SUMX(
    Virtual,
    [X] * [X]
)

//Measure 5
Y^2 = VAR CurrentX = SELECTEDVALUE(MTCarAttributez2[Attribute])
VAR CurrentY = SELECTEDVALUE(MTCarAttributez1[Attribute])
VAR Virtual =
SUMMARIZE(
    MTCarsPivotz,
    MTCarsPivotz[Index],
    "X", CALCULATE(MAX(MTCarsPivotz[Value]), MTCarsPivotz[Attribute] = CurrentX),
    "Y", CALCULATE(MAX(MTCarsPivotz[Value]), MTCarsPivotz[Attribute] = CurrentY)
)
RETURN
SUMX(
    Virtual,
    [Y] * [Y]
)
//Measure 6
n = DISTINCTCOUNT(MTCarsPivotz[Index])
And the finally we have all the elements now to create the Correlation coefficient formula in DAX
CorrelationCoef =
DIVIDE(
    [n]*[XY] - [X]*[Y],
    SQRT(
        ([n]*[X^2] - [X]^2)*([n]*[Y^2]-[Y]^2)
    )
)
And there you have it!